
Support notices first. Three tickets in ten minutes, all saying roughly the same thing: the page spins, and then it errors.
The engineer on call opens the dashboard. CPU across the fleet is 34%. Memory is comfortable. Disk is nowhere near full. Every instance is passing its health check, every target in the load balancer is marked healthy, and there is no alarm in any state other than OK.
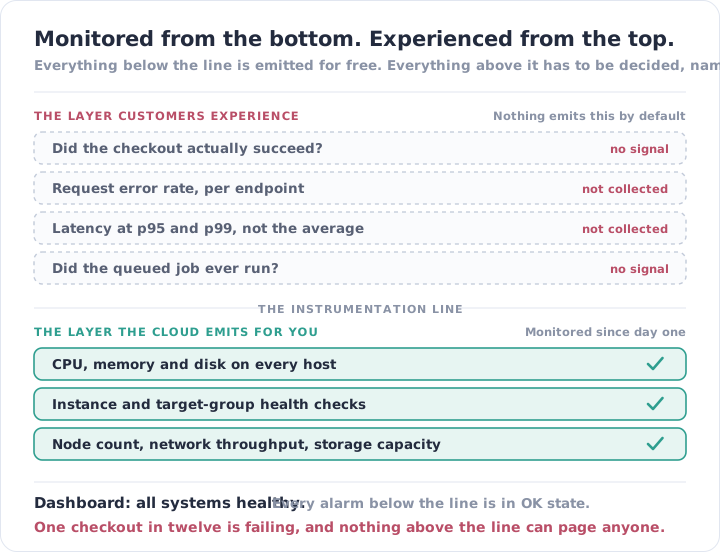
Nothing is wrong. Except that roughly one checkout in twelve has been returning a 500 for the last forty minutes, and nothing on that screen can see it.
The dashboard is not broken and it is not lying. It is answering a question nobody asked. It answers are the machines healthy. The customer asked did my request succeed, and how long did it take. Those are different questions, and on a bad day they have different answers.
Nobody Decided to Skip This
No team we have taken over sat down and chose to monitor the hosts and not the requests. The gap opens because of an asymmetry that has nothing to do with priorities.
Infrastructure metrics arrive by themselves. Launch an instance and CPU utilisation exists. Attach a volume and disk metrics exist. Nobody chose them, named them, or shipped anything to produce them — the provider emits them because it can, from outside your software, without knowing anything about what you built.
Application metrics have to be invented. There is no default request error rate, because there is no default idea of what a request is in your system. Someone has to decide the metric should exist, decide what counts as an error, name it, choose its labels, and ship code that emits it. Every one of those is a decision only your team can make.
That makes it product work, not ops work. Infrastructure monitoring is done once, at setup, by whoever builds the platform — a task with a clear end. Instrumentation is a change to the application, so it enters the same backlog as features, gets estimated against them, and loses. Not once, dramatically. Every sprint, quietly.
The metrics that matter most are the ones that cost most. Per-endpoint, per-status, per-customer, per-release: those labels are exactly what makes an error rate useful, and exactly what metered observability pricing charges for. The tooling bills on cardinality, and usefulness is cardinality. That is the same trap as everything else in what monitoring SaaS vendors won’t tell you about pricing — the good decision is the expensive one, so it gets deferred.
And the infrastructure view is genuinely reassuring. This is the part that does the damage. A blank screen prompts someone to ask what is missing. A green one does not. The dashboard is full, it updates in real time, and every number on it is correct — which is why nobody looks at it and thinks this is only half the picture.
What the Green Dashboard Cannot See
Across estates we have inherited, the same categories come up again and again. Not one of them moves a host metric.
- A partial failure. Three per cent of requests are failing. Every host is up, every health check passes, aggregate CPU is unchanged. It is not an outage to any infrastructure metric. It is a complete outage to three per cent of your customers, and it can run for days.
- A slow dependency, which reads as health. A payment provider or third-party API starts taking nine seconds. Your application threads sit blocked, waiting. CPU falls. The dashboard registers the improvement and reports it as good news, while every customer at that step is stuck.
- The tail. Mean response time is 240ms and has not moved. The 99th percentile is eleven seconds. An average taken over thousands of requests is structurally incapable of showing you the customer having a bad time — and averages are what you get by default.
- Errors returned as HTTP 200. GraphQL responses with an errors array, batch endpoints that report per-item failure, anything that puts the problem in the body. The load balancer’s 5xx count — often the only request-level number a team has — counts every one of those as a success.
- Anything asynchronous. Queue depth climbing, workers wedged on a poison message, jobs retried into a dead-letter queue nobody alarmed. The invoices don’t generate and the emails don’t send. No request fails, because nobody is making a request.
- The deploy that made it worse. Without error rate and latency broken down by release, “did that change hurt anything” is answered by waiting to see whether anyone complains. Rollback decisions get made on instinct, and on how confident the person who shipped it sounds.
- The endpoint that matters and is rarely used. Password reset. The webhook your largest customer depends on. The monthly export. Low traffic, so even an aggregate error rate — if you had one — would not move when it breaks entirely.
The cost lands in detection, not diagnosis. Once someone knows what is wrong, a competent engineer will find it. The damage is done in the interval before that, and for every item on this list the detection path is a customer deciding to tell you. MTTR is four numbers wearing a trench coat, and the first of them — time to detect — is the one this gap inflates. It is not slow. It is out of your hands entirely.
Most of the First Layer Is Not a Code Change
The usual reaction is that closing this means adopting APM, and adopting APM is a quarter of work nobody has. Some of it is. Most of the first and highest-value layer is not code at all, because the request already passes through infrastructure you own, and that infrastructure is already counting.
Start with what is emitted and unalarmed. Load balancer and ingress metrics give you request count, 4xx and 5xx by target group, and target response time at percentiles. On most estates we take over, those metrics are being collected and nothing is alerting on them. That is a configuration change, not an engineering project, and it turns “one checkout in twelve is failing” from invisible into a page.
Then split by route. Access logs already contain the path, the status and the duration of every request. Turning them into error rate and latency per endpoint needs a parser and a dashboard, not a deploy. This is also the point where logs sitting apart from metrics stops being an inconvenience and starts costing incident time — the errors behind the latency spike are right there, in a different tool, matched up by hand at 3am.
Check the journey, not the health endpoint. A GET on the homepage proves TLS works and a process is listening. A scripted login, search and add-to-basket, run from outside your network every minute, proves the product works. That difference is most of the value of synthetic checks, and most teams have only the first kind.
Use the exporters for what you already run. Nginx, the application server, the queue broker, the cache, the database. Each publishes request counts, error counts and latency about the traffic it handles. That is real request-level signal, obtained by deploying an agent rather than by editing application code.
Instrument your own code last, and narrowly. Custom metrics earn their keep for the handful of things only your application knows — did the payment settle, did the order write succeed, did the job finish. That is a short list, which is what makes it shippable. It is not the same project as instrumenting everything.
The ordering matters more than any individual item on it. Everything above the last point can be turned on inside a week without a line of application code, which is what makes it survive contact with a product roadmap.
| Infrastructure-only | Request-level | |
|---|---|---|
| Answers | Is the host healthy? | Did the request succeed? |
| A 3% error rate is | Invisible | An alert |
| A slow dependency looks like | Falling CPU — good news | Latency on that call |
| Latency is reported as | An average, if at all | p95 and p99, per endpoint |
| A bad release shows up as | Nothing | A step change in error rate |
| Thresholds come from | A vendor default | Your own SLO |
| Detection comes from | A customer email | The signal |
The Part a Tool Can’t Do
Collecting request metrics is the easy half, and every serious platform does it. The hard half is deciding what the numbers mean.
Somebody has to decide what counts as an error. A 401 on the login endpoint is a person mistyping a password, and alerting on it is how you train a team to ignore alerts. A 401 on the webhook receiver is an integration that broke silently and is dropping your largest customer’s events. Same status code, same metric, opposite meanings — and no agent, model or default rule set can tell them apart, because the difference lives in what your business does, not in the telemetry.
The same is true of slow. Three seconds on a search is acceptable. Three seconds on add-to-basket is revenue leaving. Setting that threshold is a statement about how much degradation the business will tolerate on one specific path, which is a product decision wearing an operations hat. SLOs are how you write that down, and the writing down is the work.
Then it has to be done again. Every release adds endpoints, renames routes and splits traffic behind flags, so the judgement that was right in March describes an application that no longer exists by July. This is exactly the gap Observability 2.0 points at: more telemetry does not produce more judgement, and judgement is the scarce input. It is also why the tool was never the missing piece — you bought the tool, and somebody still has to run it, continuously, and that somebody is already committed to the roadmap.
IOanyT Innovations has been running client infrastructure for over ten years, across more than 150 engagements — most of those estates inherited rather than built by us, and nearly all of them arriving with a well-built infrastructure dashboard and nothing at all above the line.
We built Vigil to close that gap in the order above: edge and exporter metrics deployed by Terraform in the first fortnight, error rate and latency per endpoint on your own dashboards, synthetic checks that walk real user journeys rather than health endpoints, and thresholds set against what your service actually promises. Then the standing part — our team reviewing what each release changed, retiring the thresholds that stopped being true, and taking the page when one fires.
Your engineers build. We make sure that when a customer’s request fails, something other than the customer tells you.