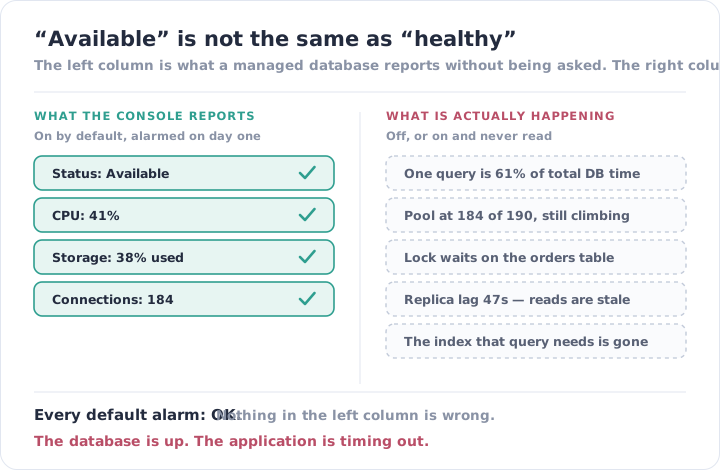
The console says Available. CPU is 41%. Storage is 38% used. Freeable memory is healthy, the failover target is in sync, and the automated backup completed at 02:00 as it has every night for a year.
The application is timing out.
This is the most common shape of database incident we inherit, and the thing worth noticing is that no metric on that screen is wrong. The instance really is available. It is answering the question the provider is accountable for — is this database running — with complete accuracy, while the question that decides whether your product works today is is this database serving your queries, and nothing on the screen addresses it.
The Managed Database Deal, Read Carefully
Moving to RDS, Aurora or Cloud SQL was the right call, and it delivered what it promised. Patching, backups, replication, failover, minor version upgrades: all genuinely handled, all things teams used to get wrong.
What quietly went with it was the person who used to watch the other half.
The default metrics are the ones collectable from outside. CPU, memory, IOPS, storage, connection count, replica lag. The provider can measure all of those without knowing anything about your schema or your queries — the same reason infrastructure metrics for your application servers arrive for free, and the same reason they stop where they do.
Everything query-shaped is opt-in. Performance Insights, the slow query log, pg_stat_statements, enhanced monitoring. Each one is off by default, or on with a retention window nobody chose, and turning it on is a conscious act somebody has to think of. The failures that matter live entirely behind that switch.
And the role that would have thought of it is gone. The DBA largely dissolved into “the cloud handles it”. What remains is a split: application developers own the queries but not the instance, the platform team owns the instance but not the queries, and query time — the one number that spans both — belongs to neither. This is nobody owns the outcome in its purest form. It is not that the metric is hard to get. It is that no job description contains “read it every week”.
Databases also degrade in a shape that thresholds miss. CPU sits at 40% while the connection pool fills, and 40% right up until the moment every remaining request queues at once. There is no gentle slope to alarm on. By the time a resource threshold trips, the outage started several minutes ago — which is why teams who did everything the console suggested still find out from support.
What Turns Up When You Actually Look
Turning on query-level visibility for a week is routinely the highest-value hour of an onboarding. The findings are strikingly consistent.
- Slow query logging was never enabled. Or it was, years ago, and no human has read the output since. The log is not missing. It is unowned.
- One query is most of the load. Almost every time. Sixty per cent or more of total database time in a single statement — usually an N+1 introduced in a release months ago, or a reporting endpoint somebody runs each morning that was never meant for production data volumes. Nobody noticed because it was never individually slow enough to be alarming. It was frequent.
- An index stopped being optional. A migration added a lookup that was fine against 200,000 rows and is not fine against forty million. The plan flipped to a sequential scan at some point nobody can name, and the application has been getting steadily slower ever since, in increments too small to investigate.
- The connection pool was sized by copy-paste.
max_connectionsleft at the instance default, the application pool set to a number from a blog post, and the two never reconciled against how many application instances now exist. Then autoscaling doubles the fleet during a spike, the pool multiplies, and the database refuses connections at exactly the moment traffic is highest. The scaling event that was supposed to absorb the load causes the outage. - Replica lag has no alert. Reads are routed to a replica that falls forty seconds behind under load. The application does not error. It serves stale data — a user updates something and it appears not to have saved — which arrives as a confusing bug report rather than an incident.
- Storage autoscaling is doing the alerting. A runaway table or unrotated logs fill the disk, autoscaling absorbs it silently, and the first signal is the invoice. A guardrail is behaving as a monitor, which means the finding surfaces to finance rather than to engineering.
- Throttling is treated as background noise. On DynamoDB, throttled requests are a metric with no alarm and retries that mask it, until concurrency rises enough that the retries stop working. On the relational side, the equivalent is lock waits on a hot table that nothing measures at all.
- Nothing connects a latency spike to the query behind it. The application graph shows the spike, the database logs hold the cause, and the two sit in different tools with unaligned timestamps. So the correlation gets done manually, by whoever is awake, during the incident.
None of this reflects a careless team. These estates are typically well run — provisioned sensibly, backed up properly, failover tested. The gap is not diligence. It is that the console offers a complete-looking set of green metrics, and nothing about that view suggests a second view exists.
Four Questions, Not One
“Is it up?” is one question, and the console answers it well. Monitoring a database properly means asking four, in this order.
Is it up? Instance state, failover status, backup completion. Already covered, keep it.
Is it saturating? Connections in use against connections available, not the raw count. Lock waits and blocked queries. Queue depth. Replica lag with a threshold set against how stale your reads are allowed to be. These are the metrics that move before an outage rather than during one, which is what makes them worth alerting on.
Is it serving? Query latency by statement, ranked by total time consumed rather than by worst individual case — because the query that ruins your day is the mediocre one executed ten thousand times a minute, not the nightly report that takes four seconds. Error and timeout counts belong here too.
Is it drifting? This week’s top statements against last week’s. A regression introduced by a deploy is invisible as an absolute number and obvious as a change. This is the one that catches the missing index in the week it starts to matter, rather than the quarter the application becomes unusable.
The first two can be alarmed. The second two need reading — which is the difference between a database that is monitored and a database that is merely instrumented.
| ”Is it up?” monitoring | Database health monitoring | |
|---|---|---|
| Measures | Instance state, CPU, storage | Query time, saturation, lock waits, lag |
| Turned on by | Default | A decision somebody makes |
| A slow query is | Invisible until it saturates CPU | The top row of a weekly review |
| A missing index appears as | Gradual, unexplained app slowdown | A statement whose mean time changed |
| Pool exhaustion is | An app error, traced back afterwards | An alert before the pool fills |
| Stale replica reads are | A confusing bug report | A lag alert |
| Alerts fire when | The instance is unhealthy | Customers would notice |
| Reviewed | Never | Every cycle |
The Part a Tool Can’t Do
Performance Insights will tell you which query consumed the most database time this week. That is genuinely useful and it is where the automatable part ends.
It will not tell you whether the query is worth fixing. It will not tell you that the right answer is a cache rather than an index, or that the correct fix is deleting the endpoint because two people use it. It will not tell you whether adding an index to a four-hundred-million-row table can be done at two in the afternoon or needs a maintenance window and a concurrent build. Those are judgements about your schema, your traffic shape and your tolerance for risk, and they are made by a person who understands all three.
And the list changes. Next month’s top query is a different query, because a release shipped. A database review is a standing commitment, not a setup task — which makes it the same species of work as tuning alerts and keeping the inventory honest. All three lose to product deadlines for the same reason: they are never urgent this week, and they are never finished.
IOanyT Innovations has been running client infrastructure for over ten years, across more than 150 engagements. In that time we have been paged for a database that reported itself unavailable a handful of times, and for databases that were entirely available and no longer serving far more often than that.
Vigil monitors RDS, Aurora and DynamoDB for the second kind: exporters deployed by Terraform inside your own accounts, query performance and connection pool saturation on your dashboards next to the application metrics they explain, lag and lock-wait alerts tuned to your read tolerance, and a monthly review of what moved. When something fires, it reaches our on-call first.
Your engineers write the queries. We make sure somebody is reading what they cost.