kubectl get pods returns a wall of Running. Every node is Ready. The control plane is healthy, the cluster autoscaler is doing its job, and the deployment that shipped this morning rolled out without a hitch.
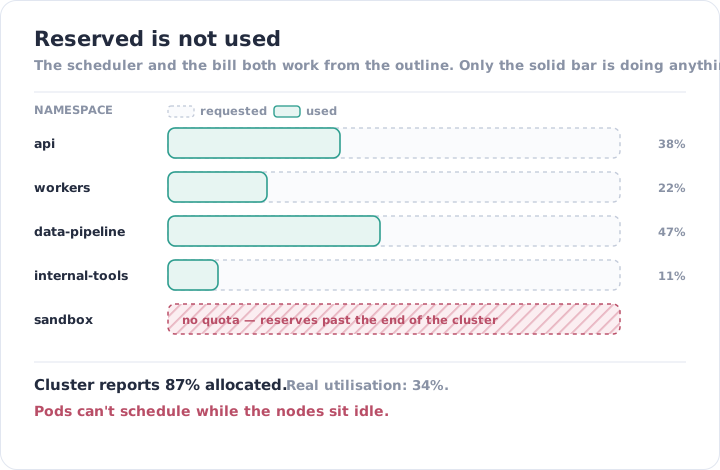
Then, at some point that is never convenient, pods in one namespace start getting OOMKilled. A deployment that has worked for a year cannot schedule a replica. The autoscaler adds nodes that do not help. And the first person to look at it discovers that the cluster has been running at 87% allocated and 34% actually used for months, and that nothing in the setup was ever going to say so.
Kubernetes is unusually good at telling you what state something is in. It is close to silent on whether that state is a sensible one.
Running Is a State. Sized Is a Ratio.
Every default signal in a Kubernetes setup is a state: Running, Ready, Available, Bound. States are binary, cheap to collect, and easy to alarm on — which is exactly why they are what everybody has.
The number that decides whether your cluster works next month is not a state. It is a ratio, and there are two of them.
What you requested against what you use. A resource request is a reservation. The scheduler takes it out of the pool whether the pod uses it or not. Set requests too high and you pay for capacity nobody consumes, while the scheduler refuses to place new work on nodes that are visibly idle. Set them too low and the pod gets CPU-throttled or OOMKilled the first time real traffic arrives.
What one namespace takes against what the others need. Without quotas, a single team’s overcommit is not a problem in that team’s namespace. It is a problem in somebody else’s, as a pod that will not schedule or an eviction during the next node drain.
Neither ratio is emitted. Both have to be computed, from two sources, over a window long enough to be meaningful.
Why It Goes Unmeasured
The two halves of the ratio live in different places. What you requested is in YAML, in Git. What you used is in the metrics server, retained for a few minutes by default. Comparing them over the weeks it takes to see a pattern needs both, stored, joined — which is a small project, and small projects need an owner.
kubectl top looks like the answer and is not. It shows current usage. Right-sizing needs the peak over a fortnight compared against the reservation, per container. A snapshot of this minute cannot tell you whether the 2Gi you asked for was a good guess.
The requests were never a decision in the first place. On almost every cluster we inherit, the resource block in the first deployment was copied from an example, and every deployment since copied that one. The numbers are not wrong on purpose. They were never right on purpose either.
And nobody owns the ratio. Application teams own their deployments and the YAML in them. The platform team owns the nodes and the bill. The relationship between the two — whether what teams ask for bears any relation to what they use — sits between the two job descriptions, which is the same structural gap behind you bought the tool, but who’s running it. It is not a hard measurement. It is an unowned one.
What Turns Up When You Actually Look
Put requested and used side by side for a fortnight, per namespace and per workload, and the same findings arrive in almost every cluster.
- Every deployment asks for the same thing. One CPU, two gigabytes, across forty workloads with wildly different jobs. The cron that runs for eight seconds a day holds the same reservation as the API.
- The cluster is “full” while the nodes are idle. Pods will not schedule because reservations are exhausted, so the autoscaler adds nodes, which are also mostly idle, which lowers real utilisation further and raises the bill. The failure looks like a capacity shortage and is a bookkeeping one.
- Some workloads have no limits at all. One pod can consume an entire node, and eventually one does — usually a memory leak in something nobody thinks of as critical, taking down whatever it was scheduled next to.
- CPU throttling nobody can see. The pod is not killed. It is just slow, in bursts, under load. That surfaces as application latency with no infrastructure signal behind it — the exact blind spot in the servers are fine, the users aren’t, with a cause that only shows up in a metric nobody collects.
- Restarts treated as weather. A container OOMKills, restarts, and serves traffic again. The restart count climbs quietly for months. Nobody alarms on it because the pod is, after all, Running.
- No quotas, so overcommit is everyone’s problem. One namespace expands until the cluster cannot place anything else. The team that caused it sees no symptom at all.
- No PodDisruptionBudgets. A routine node drain during an upgrade takes every replica of a service at once, converting maintenance into an outage.
- HPA and the cluster autoscaler working against each other. Horizontal scaling adds pods that cannot be placed; the cluster autoscaler adds nodes to place them; the load subsides; the pods go away and the nodes linger.
None of this shows up as a failure until it does. That is the pattern. Every one of these findings is stable — the cluster runs like this for months without complaint — right up to the point where a traffic increase, a node upgrade or one new deployment turns a slow leak into an eviction cascade at three in the morning.
Measure the Ratio, Alarm on the Symptoms
The fix splits neatly into a thing to review and a set of things to alert on, and confusing the two is why most attempts stall.
Review the ratio, on a cadence. Requested against used, per workload, over a rolling fortnight, with the biggest gaps at the top. This is a report somebody reads, not an alert — nobody should be paged because a container is over-provisioned. The output is a list of right-sizing changes, and it is worth real money: on most clusters we take over the first pass returns thirty to fifty per cent of the compute bill, which is the same waste-nobody-adds-up described in the $700K infrastructure illusion.
Alarm on the symptoms of getting it wrong. OOMKills and restart counts. CPU throttling above a threshold. Pods pending longer than a scheduling attempt should take. Node pressure conditions. These are events with customer consequences and they belong in the alerting path.
Put quotas on namespaces so overcommit is local. A team that over-reserves should hit its own ceiling, not somebody else’s. This is the single change that converts a shared, untraceable problem into an owned one.
Set budgets before the upgrade, not after. PodDisruptionBudgets and anti-affinity are cheap to declare and only ever get written after the drain that proved they were needed.
| State monitoring | Sizing monitoring | |
|---|---|---|
| Reports | Running, Ready, Available | Requested against used |
| Collected | By default | Computed from two sources |
| Over-provisioning is | Invisible | The top row of a review |
| Throttling is | Invisible | An alert |
| An OOMKill is | A restart | An event with an owner |
| Overcommit surfaces as | Someone else’s pending pod | A namespace hitting its quota |
| Cluster is full when | Reservations run out | Capacity runs out |
| Reviewed | Never | Every cycle |
The Part a Tool Can’t Do
Every recommendation engine on the market will tell you that a container requesting two gigabytes is using four hundred megabytes and should be cut. Most of the time it is right. The times it is wrong are the ones that matter.
Somebody has to know that the workload’s fortnightly peak is not in the fortnight of data being examined, because the month-end job has not run yet. Somebody has to decide that this particular service is allowed to be throttled and that one is not — a judgement about customer impact, not about resource efficiency. Somebody has to know that the memory headroom on the payments service is deliberate, because the last time it was trimmed it OOMKilled during a retry storm.
And it does not hold still. Every release changes the shape of the workload, every new service arrives with copied requests, and a right-sizing pass is accurate for about as long as it takes the next deployment to ship. That makes it a standing review rather than a project — the same species of never-finished work as keeping the inventory honest, and it loses to product deadlines for the same reason.
IOanyT Innovations has been running client infrastructure for over ten years, across more than 150 engagements, and has yet to inherit a cluster where requested and used were within sight of each other on the first pass.
Vigil collects cluster, node, namespace and pod metrics through Terraform-deployed agents inside your own accounts, keeps them long enough for the ratio to mean something, and puts throttling, OOMKills and pending pods into the alerting path where they belong. The right-sizing report comes to our team monthly, with the changes proposed — not to a queue on your platform engineer’s desk.
Your engineers ship to the cluster. We make sure the cluster is the size it needs to be.