Ask a team which cloud they run on and the answer comes back fast. AWS. Then ask whether anything at all runs somewhere else, and the sentence changes shape.
“There’s a bit of Azure.”
“The data team has some GCP.”
“There are a few droplets from before, I think.”
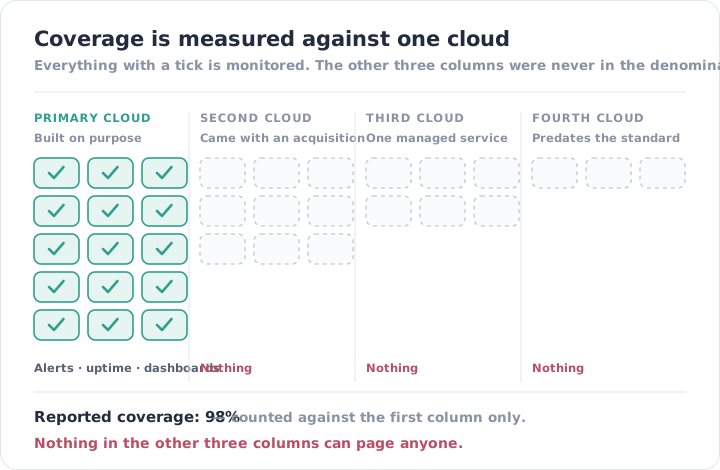
That change in register is the finding. The primary cloud has an owner, an account structure, a runbook and a monitoring setup somebody built on purpose. The second one gets a hedge and a shrug — and everything downstream of monitoring follows the shrug.
Almost Nobody Chose Multi-Cloud
In ten years of taking over infrastructure, we have rarely met a team that sat down and decided to be multi-cloud. We meet teams that became multi-cloud, one reasonable decision at a time.
- An acquisition arrives with its own estate. Its own provider, its own tooling, its own billing account, and a team that is now busy being integrated.
- One managed service only exists over there. The identity directory, the data warehouse, the GPU capacity. The rest of the platform stays where it is; that one piece doesn’t.
- A contract requires it. A customer’s procurement, a data-residency clause, or a partner integration puts one workload on a provider you don’t otherwise use.
- A team moved quickly once. Capacity was available somewhere else on the day it was needed, and the thing that was stood up in a hurry is still serving traffic.
- Something predates the standard. Droplets or VMs from before the migration, still up, still doing a job nobody has re-homed.
Every one of those arrives with a business reason and a deadline. Not one of them arrives with a monitoring project attached.
Why the Second Cloud Goes Dark
The instinct is to call this an integration gap — connect the second provider to the tool you already have and move on. It stays open because the tooling is provider-shaped in ways that don’t survive the trip.
Resources are identified differently. An ARN, an Azure resource ID and a GCP project path are not the same kind of string, and nothing keyed to one of them holds the others. Every list, tag convention and ownership map you built is quietly single-provider.
Metrics share names without sharing meanings. CPU on an EC2 instance and CPU on an Azure VM sound like the same measurement. The sampling interval, the default aggregation, what you get without paying extra, and what counts as “the disk” on a managed service are all different. A threshold that is well-tuned in one place is a guess in the other.
Alerts are different objects entirely. CloudWatch alarms, Azure Monitor alert rules with action groups, Cloud Monitoring policies with notification channels. Each has its own severity vocabulary, its own routing model, and its own idea of what an alert is attached to. There is no shared definition of “critical” to port.
The plumbing is different too. Different agents, different permission models to get read access at all, different retention defaults, different metering on the bill.
So bringing the second cloud up to the standard of the first is not a port. It is a rebuild, in a second dialect, for the newer and smaller part of the estate — while the larger part still needs running. That work is always possible to do next quarter, which is why it usually is.
What Turns Up When You Actually Look
Every estate we take over starts the same way: a read-only role in every account, on every provider, in every region, and the result laid next to what the team believes it is running. That pass is the subject of Your Cloud Inventory Is Already Wrong — and the multi-provider version of it has a recurring list of its own.
- The acquisition, still on the seller’s tooling. Monitored by whatever the acquired company bought, alerting to a mailbox at a domain that is being wound down, on a subscription nobody in your finance team recognises.
- One production-critical service, native to the other cloud. An identity provider, a warehouse, a queue. Customer-facing failures depend on it, and it sits outside every dashboard you have.
- Uptime checks that only cover the primary cloud’s endpoints. External checks are usually set up in the same sitting as the primary cloud’s monitoring, from the same list of URLs. Anything published from elsewhere never made the list.
- Alerts that fire into a channel nobody staffs. They exist. They work. They go to the Slack channel created for a migration that finished eighteen months ago, and is now muted by everyone who was in it.
- Two different answers to “is this a P1?” The severity vocabularies don’t line up, so the same class of failure pages someone in one cloud and sends an email in the other. The 3 AM Test asks who gets the alert and who remediates. In a second cloud, those questions frequently have no answer at all — not a bad one.
- No consolidated number for anything. Not uptime, not spend, not incident count. Each provider reports on itself, so every figure that reaches leadership is a partial one presented as a total.
The second cloud is always treated as temporary. That is the through-line. The acquisition will be migrated. The workload will come back in-house when the contract renews. The droplets will be decommissioned after the next release. Each of those is a genuine plan, held sincerely — and the interim keeps extending, because migrating a running system is exactly the kind of work that loses to whatever is on the roadmap.
“Temporary” is a status, not a plan. In the meantime it serves production traffic with no detection path.
And the tool bill grows while the coverage doesn’t. Per-host, per-metric pricing means a second provider’s estate costs roughly what the first one did to instrument. So the honest options are to pay twice or to leave it dark, and leaving it dark is free today. That is the same arithmetic behind the $700K infrastructure illusion: the spend is real, and it still isn’t buying coverage.
One Model, Not One Dashboard
The fix gets marketed as a single pane of glass, which is the least interesting part of it. A view that renders three providers side by side but keeps three severity scales, three alert routes and three inventories has only moved the problem behind one URL.
What actually has to be shared sits underneath the dashboard.
One inventory, across providers. Discovery enumerates every account on every provider in the same pass and produces one list. A resource in the second cloud is a resource, not an exception handled by a different process.
One severity scale. “Critical” is defined once, in terms of your service, and each provider’s native signals are mapped onto it. The question stops being what CloudWatch calls this, and becomes what this failure does to a customer.
One rotation. The same people are on call for the whole estate, with the same escalation path. No workload is somebody’s side responsibility because of which console it happens to live in.
| Per-provider native monitoring | One model across providers | |
|---|---|---|
| Coverage is measured against | Each provider, separately | The whole estate |
| ”Critical” means | Whatever that console calls it | The same thing everywhere |
| Who gets paged | Whoever configured that account | Whoever is on call |
| A new resource in the second cloud | Waits for somebody to notice | Enters coverage on the next pass |
| One incident spanning two clouds | Two consoles, matched by timestamp | One timeline |
| What leadership sees | Numbers that can’t be added up | One reliability picture |
| Adding a third provider | Another project | Another configuration |
The last row is the one that tends to land. Whether a new provider means a quarter of work or a day of work decides how the next acquisition gets handled — and there is usually a next acquisition.
The Part a Tool Can’t Do
Collecting metrics from three providers is a connector problem, and connectors are the easy half. Every serious platform can read from all the major clouds.
The hard half is deciding what the numbers mean next to each other.
Someone has to decide that this Azure alert rule and that CloudWatch alarm represent the same failure of the same customer-facing capability, and should therefore page the same person with the same urgency. That is a judgement about your architecture. It cannot be shipped as a mapping table, because the right answer depends on what the service does, how much degradation the business tolerates, and which of the two paths customers actually traverse.
Then it has to be made again. Every new workload, every new managed service, every acquisition brings signals that don’t fit the existing scale, and somebody has to place them — and re-tune the ones that turned out wrong. Like the ownership work in a discovery pass, it never finishes, which is what makes it lose to a product deadline. Not because anyone judged it unimportant. Because it is always possible to do it next week.
That is also why “we’ll centralise the alerting” stalls at the point where it stops being configuration and starts being decisions. Alert fatigue is a management problem for the same reason: the tuning belongs to nobody in particular, so it doesn’t happen.
IOanyT Innovations has been running client infrastructure for over ten years, across more than 150 engagements — most of those estates inherited rather than built by us, and a good share of them spanning more than one provider by the time they reached us. We built Vigil to run discovery, metrics, uptime checks and alerting across AWS, Azure, GCP and DigitalOcean on one model, inside your own cloud accounts. One inventory. One definition of critical. One rotation that covers all of it — ours, not yours.
Your engineers build, wherever the workload happens to run. We make sure the second cloud isn’t the dark one.