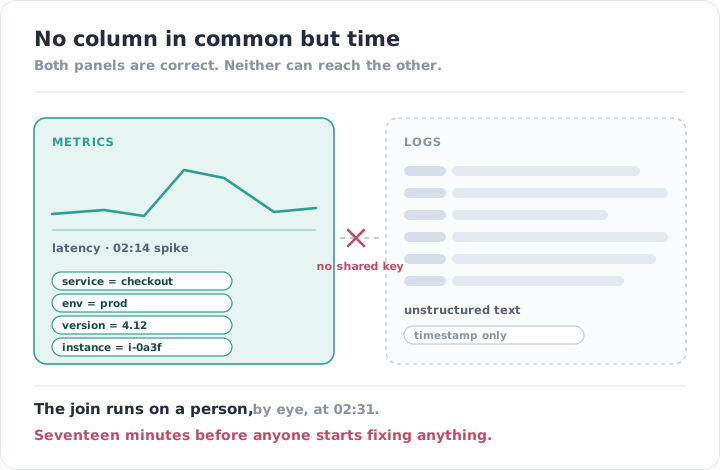
02:14. Latency on the checkout path goes from 180ms to four seconds and stays there.
The graph is unambiguous about when. To find out why, the engineer on call switches to the logging console, works out which of sixty-one log groups belongs to the service in question, writes a filter expression, sets a time range, notices the results are an hour off because the application logs in the server’s local time, corrects it, and starts reading.
It is now 02:31. Nothing has been fixed. Seventeen minutes have gone into an operation a database would call a join.
This is the most expensive unremarkable problem in monitoring. Nothing is broken. Both systems work. They simply have no idea the other exists.
Two Systems That Were Never Introduced
The split is not a design decision anybody made. It is an artefact of how the two things arrived.
Metrics came with the infrastructure. The provider emitted them, an agent scraped them, a dashboard rendered them. Ops work, done at setup, by the platform team.
Logs came with the platform default. Everything writes to stdout, something ships it to CloudWatch or its equivalent, and it accumulates. Nobody chose the format, because there wasn’t a moment where choosing was on the agenda.
So nothing ever joined them, because joining them was never a project. There is no point in any normal workflow at which someone is asked to make the graph and the log line refer to each other. Both halves work well enough alone that the gap only becomes visible during an incident, which is precisely when nobody has time to fix it.
And underneath that, they have no shared key. This is the part that survives good intentions. A metric is a time series with labels. A log line is text with a timestamp. If nobody deliberately put the same identifiers on both — the same service name, the same environment, the same instance, the same release — then the only column they have in common is time. Time is the weakest join there is: it is approximate, it is affected by clock skew and buffering, and it returns everything that happened in the window rather than the thing that caused the problem.
What Turns Up When You Actually Look
Ask to see how a team gets from a spike to a cause, and the same obstacles appear in almost every estate.
- No request identifier anywhere. A slow request cannot be followed through the three services it touched, so each service is investigated separately and the interaction between them — which is usually the actual fault — is never seen at all.
- Timestamps that do not agree. Some UTC, some local, some in the application’s own format, some buffered and written minutes after the event. Every comparison starts with a correction somebody has to remember to make.
- Log groups named after resources, not services.
/aws/lambda/prod-func-3b2tells you nothing about which part of the product it serves. Finding the right log group is a step in the investigation, every single time, and it depends on tacit knowledge one person has. - Logs that are prose. Unstructured text cannot be counted, only searched. You can find an error; you cannot ask how many, or whether it is more than yesterday, or whether it started with the deploy.
- Retention that does not line up. Metrics kept fifteen months, logs kept seven days. So a pattern that recurs monthly can be observed indefinitely and explained never.
- A dashboard with no way out of it. The panel shows the spike. Nothing on it links to the logs for that service, in that window. The runbook says “check the logs” and does not say which, because the person who wrote it knew.
- A large bill for logs nobody can use. This is the quiet one. Ingestion and retention are charged in full whether or not the data is ever successfully queried, and on most estates we take over, the log spend is substantial and the log value is close to zero. That is the same shape as everything in getting observability costs under control: the money is real and it is not buying an outcome.
The cost is paid entirely in minutes during incidents. No customer is harmed by logs and metrics living apart at two in the afternoon. The damage is concentrated into the exact window when everything is worst, and it lands on the diagnosis step — which, unlike detection, cannot be shortened by better alerting. MTTR is four numbers, and this gap inflates the third one, every time, for every incident.
The Fix Is a Naming Convention
The instinct is to solve this with a product — one platform holding both, with a correlation feature. That helps, and it is not the important part, because a single tool holding two unrelated datasets is still holding two unrelated datasets.
What actually closes the gap is agreeing on a small set of labels and putting them on everything.
Same identifiers on both sides. Service, environment, version, instance, region — emitted as metric labels and as fields in every log line, spelled identically. That is the entire mechanism. Once the strings match, a dashboard panel can hand its filter straight to the log query and the join stops being manual.
Structure the logs. JSON, or any parsed format, so fields can be queried and counted rather than grepped. This is also what makes the next point possible.
Derive metrics from logs where it earns it. Error counts per route, per status, from the log stream, as a real time series sitting next to the latency graph. That converts the most common question — is this spike accompanied by errors — from an investigation into a glance.
Carry a request id through the call path. The heaviest item on the list, and the one to do last and selectively. It is worth it for the paths where a request crosses services, and not worth it for a cron job.
Then set retention by usefulness, not by default. Full-fidelity logs for a short window, derived metrics and sampled logs for a long one. That usually reduces the bill and increases what can actually be answered, because the thing you keep for fifteen months is the thing that is small enough to keep.
| Separate | Joined by shared labels | |
|---|---|---|
| Common key | Time | service · env · version · instance |
| Getting from spike to cause | A tool switch and a guess | A filter that carries over |
| ”Are there errors behind this?” | An investigation | A panel |
| Log format | Prose | Structured fields |
| Error rate from logs | Not available | A time series |
| Retention | A default nobody chose | Set by what it answers |
| The join runs on | A person, at 3am | The label |
The Part a Tool Can’t Do
Every observability platform on the market will correlate logs and metrics for you, and the demo is genuinely impressive, because in the demo everything is already labelled.
The work is deciding the label set and getting it onto every service — including the two written by a contractor in 2022, the one nobody has deployed in eight months, and the next one, which does not exist yet. That is a standard, and a standard that is not enforced is a suggestion. Enforcement means a check in the pipeline, a review when services are created, and somebody who notices when a new service arrives without the labels and does something about it.
It is also a set of judgements no product can make for you. Which fields are worth the cardinality they cost. Which paths deserve a trace id and which are fine without. What to keep for a year and what to drop after a week — a question about which incidents you expect to have, not about storage. This is the gap Observability 2.0 describes exactly: the telemetry is not scarce, and the judgement about what it should say is.
And it is standing work. Every new service is a chance for the convention to break, and nothing fails when it does — the labels are simply missing the next time somebody needs them, at two in the morning, when it is too late to add them.
IOanyT Innovations has been running client infrastructure for over ten years, across more than 150 engagements. In that time the single most reliable predictor of how long an incident takes has not been the tooling budget. It has been whether the graph and the log line agree on what to call things.
Vigil deploys the collection through Terraform inside your own accounts with one label set across metrics and logs, derives error-rate series from log streams so they sit alongside the latency they explain, and links dashboard panels to the log query for that service and that window. Our team maintains the convention as services arrive — and takes the page, so the join happens on our hours.
Your engineers write the services. We make sure the two halves of the answer can find each other.