The dashboard on the office screen was built in the first month, by an engineer who took it seriously and did a good job. It is still the first thing anyone opens during an incident.
Four of its panels query metrics from services that were renamed in a refactor last spring. Two query metrics that stopped being emitted when the agent was upgraded. One threshold line is drawn at a request volume the product passed fourteen months ago, so the panel has been permanently in the red zone for so long that people have stopped seeing the colour. The newest and most commercially important service in the estate does not appear at all, because it launched after the dashboard was finished.
Nothing about this is visible. The dashboard renders. The panels draw. It looks exactly as authoritative as it did on the day it was built.
This Is Not the Problem Version Control Solves
The obvious response is that dashboards should be code, and that response is correct — monitoring as code is worth doing for the reasons that post gives. Reviewable changes. Reproducible environments. No more clicking a dashboard back together from memory after somebody deletes it.
None of that addresses this. A dashboard defined in Terraform and reviewed by two engineers on the day it was written goes stale on precisely the same schedule as one built by hand. The definition is version-controlled; whether the definition still describes your architecture is a different question, and no repository can answer it.
The difference is between drift in the configuration and drift in the subject. Version control keeps the file and the deployed dashboard in agreement. What rots is the agreement between the dashboard and the system — and the system changes through work that never touches the monitoring repository at all.
Dashboards Have a Birth and No Maintenance Event
There is no moment in any workflow that says “go and update the dashboard”. Deploys do not check it. Architecture reviews do not include it. Renaming a service, retiring a queue, splitting a monolith, changing an SLO — every one of those invalidates part of a dashboard, and not one of them has a step that says so. The work that breaks dashboards and the work that maintains them are done by different people at different times, and only the first kind is scheduled.
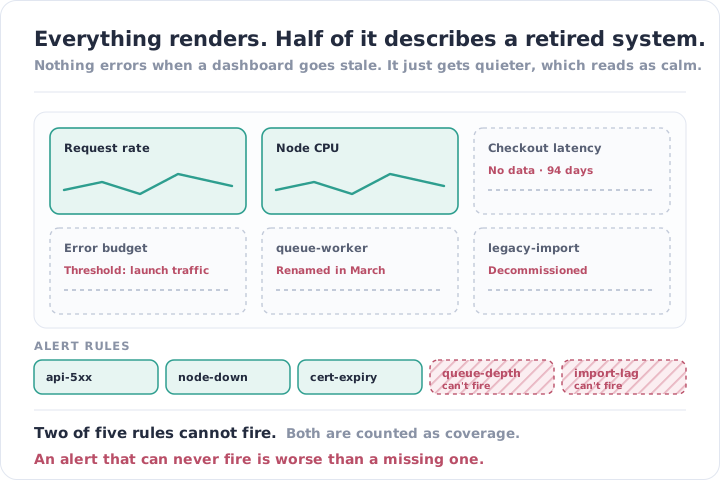
Nothing fails when it is wrong. This is the property that makes it durable. A panel querying a metric that no longer exists does not error. It renders an empty chart, or a flat line at zero, or the words “No data” in small grey type. People learn to read past it within about two weeks, and after that it is furniture.
It fails in the reassuring direction. A stale panel almost never shows a false alarm. It shows nothing, or it shows calm. So the dashboard’s decay makes the estate look healthier over time, which is the opposite of a signal that something needs attention.
And the same rot reaches the alert rules. This is the part that turns an aesthetic problem into an operational one. A rule that references a metric no longer emitted cannot fire. It sits in the list, it is counted in the coverage number, it appears in the audit evidence — and it is incapable of ever alerting anybody about anything. An alert that can never fire is worse than a missing one, because a missing one is at least an obvious gap.
What Turns Up When You Actually Look
Audit a mature monitoring setup — not the infrastructure, the monitoring itself — and the inventory is remarkably consistent.
- Panels with no data for months. Nobody removed them, because removing something takes a decision and leaving it takes nothing.
- Thresholds set against a system three sizes smaller. Latency, error-rate and queue-depth lines drawn during the first month of production traffic, never revisited as the product grew into them.
- Dashboards for services that no longer exist. Sometimes still on a wall display, showing a permanently flat line that everyone has agreed to interpret as “quiet”.
- Several dashboards with near-identical names.
Production Overview,Production Overview v2,Prod Overview (new). Nobody can say which is current, so during an incident people open two. - Alert rules that cannot fire. The most serious finding on the list. On estates we take over it is routinely a double-digit percentage of the rule set — rules referencing renamed metrics, deleted resources or labels that changed spelling.
- Alert rules nobody can explain. They fire occasionally, somebody acknowledges them, and no one currently employed knows what the threshold was chosen to represent.
- No dashboard for the newest service. Reliably the most business-critical thing in the estate and the least observed, because coverage was built once and the service arrived afterwards. Same failure as an inventory that stops being true the day after it is written, one layer up.
- The author has left. Not a fault of theirs. It matters because the tacit knowledge of what each panel was for left with them, so nobody feels confident deleting anything.
Coverage numbers are computed from this. That is what makes it more than untidiness. The percentage of services monitored, the count of alert rules, the evidence exported for a SOC2 control — all of it counts artefacts, and none of it asks whether the artefacts still work. A rule that cannot fire counts exactly the same as one that can.
Monitoring Needs Monitoring
The fix is a cadence and two mechanical checks, and the mechanical checks are what make the cadence survive contact with a busy quarter.
Alert on rules that cannot fire. Any rule referencing a metric with no data for a fortnight should raise an exception. This is straightforward to implement and it converts the worst item on the list from invisible to automatic.
Alert on panels with no data. The same check, applied to dashboards, produces a weekly list of things to fix or delete. Deleting is a legitimate outcome and usually the right one.
Review on a schedule, with an owner. Monthly or quarterly, one person walks the dashboards against the current architecture: what is new and unobserved, what is gone and still displayed, which thresholds no longer match the traffic. This is a read-and-decide task, not an engineering one, and it takes an hour when it is done regularly and a week when it is not.
Attach a review to architecture change. Retiring a service, renaming a metric or changing an SLO should carry a monitoring step in the same way it carries a documentation step. The trigger has to exist somewhere in the workflow, or the cadence is the only defence.
Track the dashboard’s own metadata. Last edited. Author. Panels with no data. Rules that have not evaluated either way in a month. A dashboard with a health indicator on it is the cheapest possible reminder that it is a maintained object rather than a permanent one.
| Built once | Reviewed on a cadence | |
|---|---|---|
| Describes | The architecture on setup day | The architecture this quarter |
| A dead panel is | Furniture | An exception this week |
| A rule that can’t fire is | Counted as coverage | An alert in its own right |
| Thresholds reflect | Launch traffic | Current traffic |
| A new service is | Unobserved | On the review list |
| Deleting things | Nobody’s decision | Part of the review |
| Coverage numbers are | A count of artefacts | A count of working ones |
The Part a Tool Can’t Do
The two mechanical checks are genuinely automatable, and they catch the most dangerous category — the rules that cannot fire. Everything above that line needs somebody who knows what changed.
A tool can see that a panel has had no data for ninety-four days. It cannot tell you whether that is because the service was retired on purpose, because a metric was renamed and the panel should be updated, or because something stopped reporting three months ago and nobody noticed. Those three findings have completely different consequences and they look identical from the outside.
Nor can it tell you that the new payments service deserves a dashboard, that the threshold on the search latency panel should now be lower because the SLO tightened, or that two of the six overview dashboards should be deleted and nobody will miss them. Those are judgements about what the system is for, and they have to be made by someone holding the current architecture in their head.
It is also the least urgent work in existence. A stale dashboard causes no incident today, this week, or this quarter. It causes one incident, eventually, on the night when the panel everybody trusted turned out to be describing a service that had been renamed in March. That is what makes it structurally identical to alert tuning and to inventory reconciliation: never urgent, never finished, and permanently second in the queue.
IOanyT Innovations has been running client infrastructure for over ten years, across more than 150 engagements. The dashboards we inherit are usually good dashboards. They are almost never current ones, and the gap is measured in whatever has changed since the person who built them moved on.
Vigil treats the monitoring as a system that itself needs monitoring: rules that cannot fire and panels with no data are raised as exceptions, dashboards carry their own freshness, and our team walks the whole set against your architecture every month — adding what is new, retiring what is gone, and re-tuning what your traffic outgrew.
Your engineers change the system. We make sure the thing watching it changes too.